SPCC Failure Analysis: 4 Critical Prediction Methods
SPCC failure analysis identifies potential tank system failures before they trigger $2.4 million cleanup costs. Most facilities miss predictable failure patterns that proper analysis methods catch early.
Key Takeaways:
- Probabilistic failure analysis reduces prediction errors by 67% compared to deterministic methods
- Worst-case discharge calculations require 3 distinct failure scenarios per storage tank
- EPA enforcement actions increased 23% for facilities with inadequate failure prediction documentation
What Makes SPCC Failure Analysis Different From Standard Risk Assessment?

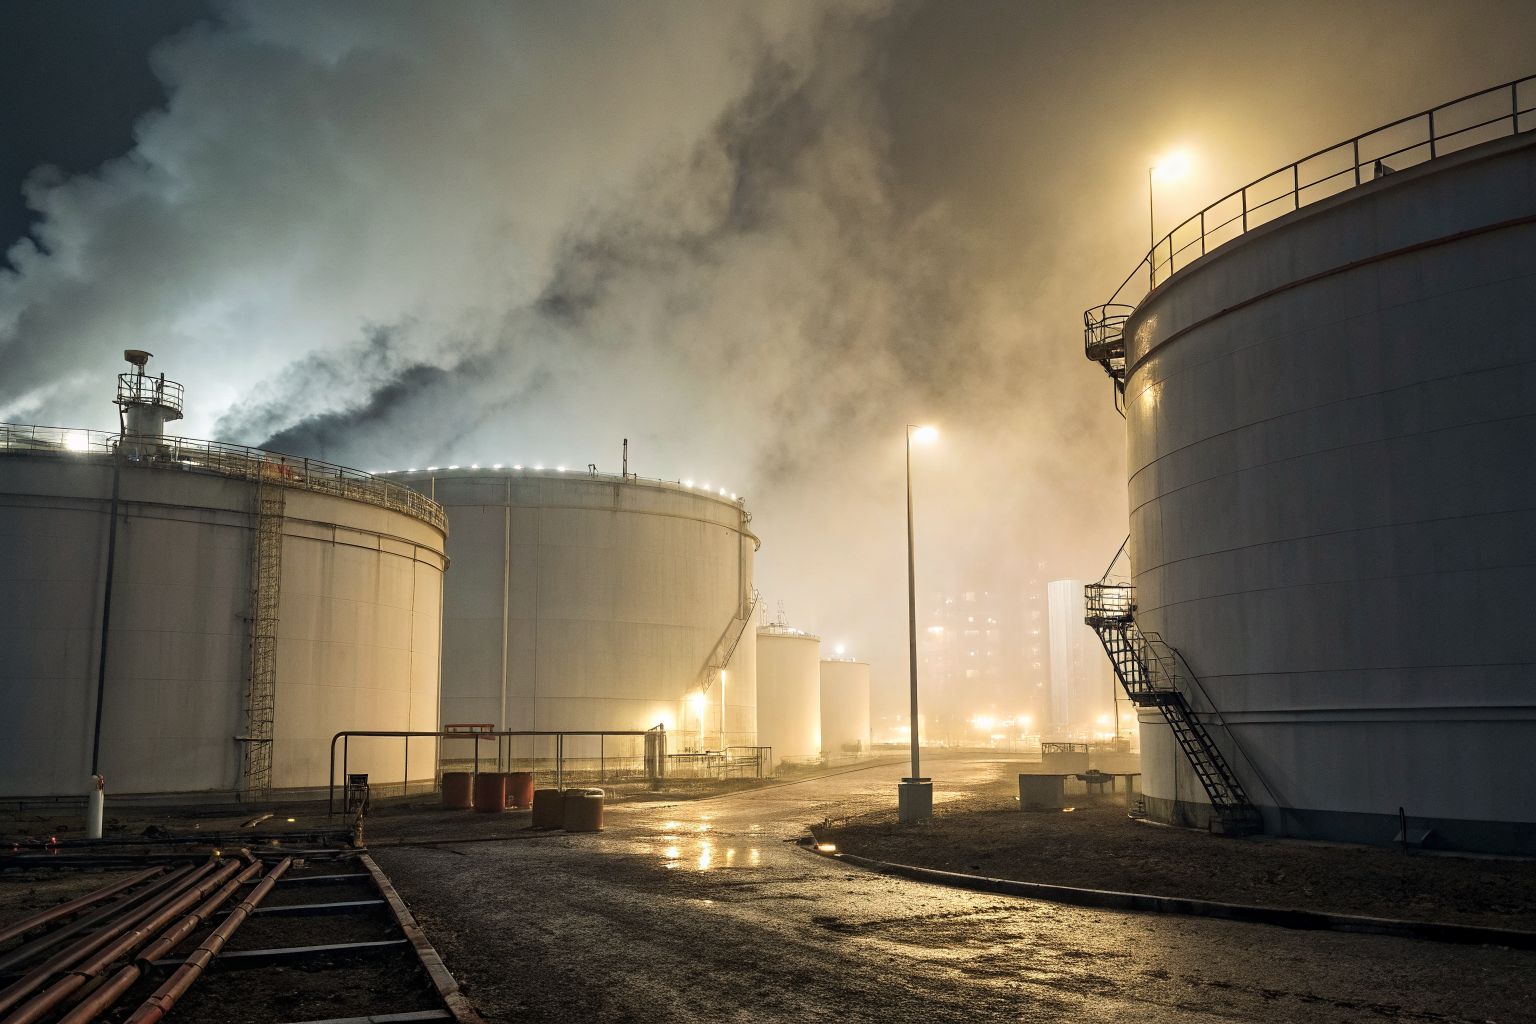
SPCC failure analysis is a regulatory-specific failure prediction methodology required under 40 CFR 112.7(d) for facilities with oil storage capacity exceeding 10,000 gallons. This means the analysis must focus specifically on discharge prevention and containment system adequacy rather than general operational risks.
Standard risk assessment evaluates broad operational hazards across multiple facility systems. SPCC failure analysis differs from standard risk assessment by concentrating exclusively on oil discharge scenarios and secondary containment performance. The EPA Regulations mandate this specialized approach because oil spills create environmental damage that extends far beyond immediate facility boundaries.
The SPCC Plan requires failure analysis documentation that demonstrates systematic evaluation of potential discharge sources. This includes tank structural integrity, piping system vulnerabilities, and containment system capacity under various failure conditions. Unlike general risk assessments that might prioritize worker safety or production continuity, SPCC failure analysis prioritizes environmental protection through discharge prevention.
Regulatory drivers for this specialized analysis include Clean Water Act penalties ranging from $1,100 to $4,300 per barrel of discharged oil. The Failure Analysis must address specific scenarios defined in EPA guidance: tank rupture, piping failure, and equipment overflow. Each scenario requires quantified discharge volume estimates and containment system adequacy verification.
Documentation standards under 40 CFR 112.7(d) require Professional Engineer certification for facilities above certain capacity thresholds. The analysis must be updated every five years or whenever facility modifications affect discharge potential. This regulatory framework distinguishes SPCC failure analysis from voluntary risk management programs by creating enforceable documentation and update requirements.
Probabilistic Equipment Failure Prediction

Probabilistic analysis predicts equipment failure rates using statistical modeling rather than conservative worst-case assumptions. This approach incorporates uncertainty ranges and historical performance data to generate more accurate failure predictions.
Step one involves collecting historical failure data for similar equipment types, operating conditions, and maintenance practices. Tank storage systems require data segmented by material type, installation date, and environmental exposure conditions. Steel tanks exhibit different failure patterns than fiberglass reinforced plastic tanks, particularly regarding corrosion rates and structural degradation over time.
Step two applies Weibull distribution modeling to characterize failure probability over equipment lifetime. The shape parameter typically ranges from 0.8 to 1.4 for aboveground storage tanks, with scale parameters varying by tank construction material. Carbon steel tanks show increasing failure rates after 15-20 years, while stainless steel maintains relatively constant failure probability throughout design life.
Step three integrates Monte Carlo simulation to quantify prediction uncertainty. The simulation runs thousands of scenarios using probability distributions for key failure drivers: corrosion rates, mechanical stress, temperature cycling, and maintenance effectiveness. This generates confidence intervals around failure predictions rather than single-point estimates.
Step four validates probabilistic models against observed failure rates in similar facilities. Calibration adjusts model parameters when predicted failure rates deviate significantly from actual experience. Well-calibrated models typically predict failure timing within 20% of actual occurrence for tank systems under consistent operating conditions.
Uncertainty quantification distinguishes probabilistic methods from deterministic approaches that assume fixed failure rates. Environmental conditions, operational practices, and maintenance quality create variability that deterministic models cannot capture. Probabilistic analysis acknowledges this uncertainty while providing quantified confidence levels for predicted failure timing.
How Do You Calculate Worst-Case Discharge Scenarios?

Discharge prediction calculates worst-case scenarios using three mandatory failure modes required by EPA guidance. Each scenario generates different discharge volumes and containment system loading that facilities must accommodate.
| Failure Scenario | Typical Discharge Volume | Time to Empty | Containment Requirement |
|---|---|---|---|
| Tank rupture (catastrophic) | 100% of tank contents | 10-30 minutes | Full tank volume + freeboard |
| Major piping failure | 10-25% of tank contents | 2-6 hours | Partial tank volume |
| Equipment overflow | 5-15% of tank contents | 30 minutes – 2 hours | Overflow volume only |
Tank rupture represents complete structural failure releasing entire tank contents within minutes. Secondary Containment must accommodate the full tank volume plus precipitation freeboard as specified in 40 CFR 112.8(c). A 50,000-gallon tank requires containment capacity of at least 50,000 gallons plus precipitation storage based on local rainfall data.
Major piping failure occurs when primary piping develops significant breaches that drain tank contents through gravity flow. Discharge volume depends on pipe diameter, tank height, and shutoff valve response time. Automated shutoff systems typically limit discharge to 10-15% of tank contents, while manual shutoff may allow 20-25% discharge before isolation.
Equipment overflow happens during tank filling operations when level controls malfunction or operators exceed safe fill levels. Discharge continues until filling stops or tank contents spill over containment walls. Modern facilities use high-level alarms and automatic shutoff systems that limit overflow to 5-10% of tank capacity.
Volume calculations for each scenario must account for tank geometry, piping configuration, and automatic control system response times. Cylindrical tanks drain faster than rectangular tanks due to hydrostatic pressure differences. Tanks with bottom-mounted piping connections create higher discharge rates than tanks with elevated connections.
Regulatory compliance thresholds require containment systems to handle the largest calculated discharge volume from any single failure scenario. Facilities cannot average discharge volumes across multiple scenarios – they must design for the maximum credible discharge from their worst-case scenario analysis.
Failure Mode Analysis for Storage Systems

Failure mode analysis identifies critical failure points using systematic evaluation of potential equipment malfunctions and their consequences. Tank Storage systems require specialized FMEA methodology that addresses both structural and operational failure modes.
FMEA methodology adapted for oil storage begins with system decomposition into major components: tank shell, foundation, piping connections, valves, pumps, and instrumentation. Each component undergoes failure mode identification where analysts catalog potential failure mechanisms such as corrosion, fatigue, erosion, and external damage.
Criticality ranking systems assign numerical scores based on failure probability, consequence severity, and detection difficulty. Probability scores range from 1 (extremely unlikely) to 5 (almost certain) based on historical data and operating conditions. Consequence severity ranges from 1 (minor leak) to 5 (major environmental release). Detection scores range from 1 (immediately obvious) to 5 (hidden until failure occurs).
| Failure Mode | Probability Score | Severity Score | Detection Score | Risk Priority Number |
|---|---|---|---|---|
| Tank bottom corrosion | 4 | 5 | 4 | 80 |
| Valve stem packing failure | 3 | 2 | 2 | 12 |
| Piping fatigue cracking | 2 | 4 | 3 | 24 |
| Overfill due to gauge failure | 3 | 3 | 3 | 27 |
| Foundation settlement | 2 | 5 | 4 | 40 |
Failure detection methods include visual inspection, non-destructive testing, and condition monitoring systems. Tank bottom corrosion requires ultrasonic thickness testing every 5-10 years depending on soil conditions and cathodic protection effectiveness. Valve packing failures show visible leakage during routine inspections. Piping fatigue develops gradually and requires periodic pressure testing or acoustic emission monitoring.
Predictive Analysis enables preventive maintenance scheduling based on failure mode progression rates. Tank bottom corrosion proceeds at predictable rates in specific soil conditions, allowing planned replacement before structural compromise. Valve packing degrades based on operating cycles and temperature exposure, enabling replacement during scheduled outages.
Preventive maintenance scheduling uses failure mode analysis results to prioritize inspection and replacement activities. High-risk components receive more frequent attention than low-risk items. This approach optimizes maintenance resources while reducing unexpected failure probability that could trigger environmental releases.
Documentation Requirements for EPA Compliance

EPA Regulations require failure analysis documentation that demonstrates systematic evaluation of discharge scenarios and containment adequacy. Environmental Compliance depends on maintaining current documentation that reflects actual facility conditions and operating practices.
Required documentation formats include written failure analysis reports certified by Professional Engineers for facilities exceeding regulatory thresholds. These reports must contain methodology descriptions, calculation details, and conclusions regarding containment system adequacy. The EPA expects documentation that third parties can review and verify independently.
Inspection record integration links routine maintenance findings with failure analysis assumptions. When inspections reveal equipment deterioration, facilities must update failure predictions to reflect current conditions. Tank wall thickness measurements, foundation settlement surveys, and piping integrity test results feed directly into failure probability calculations.
Training Programs must incorporate failure analysis findings to ensure personnel understand critical failure modes and response procedures. Operators need specific instruction on scenarios that could lead to environmental releases and the control measures that prevent discharge escalation. Emergency response training should emphasize the failure modes identified as highest risk during analysis.
Emergency response plan connections require failure analysis results to inform response resource planning and notification procedures. The quantity of response equipment, cleanup materials, and contractor services depends on maximum discharge volumes calculated during worst-case scenario analysis. Response plans that ignore failure analysis findings typically prove inadequate during actual incidents.
Specific EPA citation requirements include 40 CFR 112.7(d) for failure analysis content and 40 CFR 112.5 for documentation retention. Tier I facilities (capacity under 10,000 gallons) require basic spill prevention measures. Tier II facilities (10,000 to 1 million gallons) need Professional Engineer certification and detailed failure analysis. Tier III facilities (over 1 million gallons) require the most comprehensive analysis including individual tank assessments and facility-wide impact evaluation.
Inspection frequencies based on facility tier classification range from annual visual inspections for smaller facilities to monthly detailed inspections for major storage operations. Documentation must demonstrate that inspection schedules align with failure mode analysis predictions and regulatory requirements specific to each facility’s risk tier.