
SPCC Freeboard Calculation: How to Calculate 25-Year Storm Requirements
SPCC freeboard calculation errors cost facilities an average of $47,000 per inspection violation because most engineers misunderstand the 25-year storm requirement. This guide shows exactly how to calculate proper freeboard heights using NOAA precipitation data and EPA-compliant formulas.
Key Takeaways:
- EPA requires secondary containment systems to handle 25-year, 24-hour precipitation events plus 6 inches of freeboard minimum
- Precipitation volume calculations must use NOAA Atlas 14 data specific to your facility’s exact coordinates, not regional averages
- Freeboard height equals precipitation depth plus 6 inches, with calculations based on containment area footprint, not tank footprint
What Is SPCC Freeboard and Why Does It Matter?
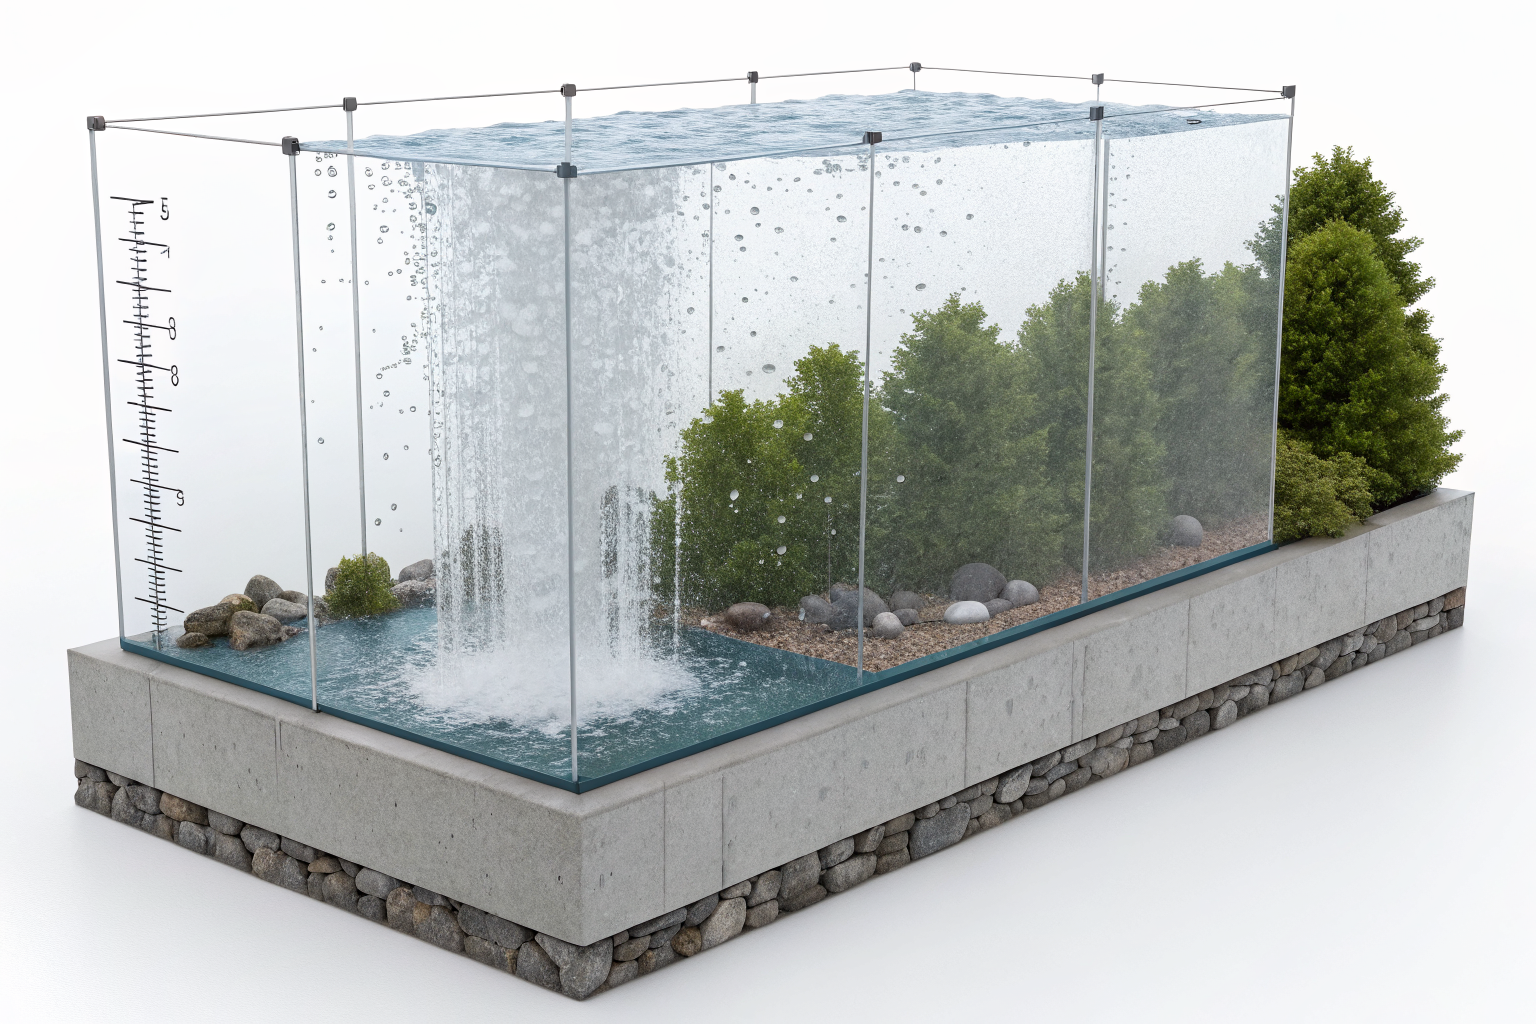
SPCC freeboard is the vertical distance between the highest liquid level in secondary containment and the top of the containment wall. This means your containment system must have enough empty space above normal operating levels to prevent overflow during storm events. For example, if your containment dike holds 2 feet of liquid during normal operations and the wall stands 4 feet high, you have 2 feet of freeboard.
SPCC freeboard prevents spill overflow during precipitation events by providing a buffer zone for accumulated rainwater. The regulatory purpose stems from 40 CFR 112.8(c)(2), which specifies a 6-inch minimum freeboard requirement for all oil storage facilities. The EPA established this standard after analyzing thousands of spill incidents where inadequate freeboard caused contained oil to overflow during storms.
This differs from general engineering freeboard concepts used in civil infrastructure. Standard engineering freeboard accounts for wave action, settling, and construction tolerances. SPCC freeboard specifically addresses precipitation accumulation and oil displacement in secondary containment systems. The calculation methodology focuses on storm water volume rather than structural safety factors.
Spill prevention regulations treat freeboard as an active safety margin, not just a design buffer. Your containment system must demonstrate adequate freeboard under worst-case precipitation scenarios while maintaining full oil storage capacity. This dual requirement drives the specific calculation approach mandated by EPA guidance documents.
Bulk storage facilities face stricter freeboard requirements because larger tank volumes displace more precipitation within containment areas. The relationship between stored volume and available freeboard determines compliance status during EPA inspections.
How Do You Find Your 25-Year, 24-Hour Storm Data?

NOAA Atlas 14 provides precipitation frequency estimates for SPCC compliance through an interactive online mapping system. This federal database contains the most current precipitation statistics required for regulatory calculations.
Step 1: Navigate to the NOAA Atlas 14 Point Precipitation Frequency Estimates website and locate the interactive map for your region. The system divides the United States into volumes covering different geographic areas.
Step 2: Enter your facility’s exact latitude and longitude coordinates or click directly on your location on the map. Avoid using nearby weather station data or regional averages. EPA requires site-specific calculations based on your precise coordinates.
Step 3: Select the 25-year return period and 24-hour duration from the dropdown menus. The system will display precipitation depth in inches for your specific location. Record this value with at least two decimal places for calculation accuracy.
Step 4: Download the complete precipitation frequency table for your coordinates. This provides backup data and allows verification of your selected values. The table includes confidence intervals that may be relevant for engineering design margins.
Step 5: Verify the data vintage and update frequency. NOAA Atlas 14 covers precipitation frequencies from 5 minutes to 60 days across different return periods, but the agency updates regional data periodically. Check the metadata to ensure you’re using current information.
Common mistakes include using outdated Technical Paper 40 data, selecting wrong return periods, or interpolating between weather stations. EPA inspectors specifically check precipitation data sources during compliance reviews. Your SPCC plan documentation must reference the specific NOAA Atlas 14 extraction date and coordinates used in calculations.
SPCC Precipitation Volume Calculation Formula
Precipitation volume equals rainfall depth multiplied by containment area using this fundamental formula. The calculation converts inches of rainfall over a specific area into total gallons of water that accumulate in your secondary containment system.
Step 1: Measure the inside dimensions of your secondary containment footprint. Use the interior area where precipitation actually collects, not the exterior dimensions of dike walls or curbing. For rectangular containment, multiply length times width. For circular containment, use π × radius².
Step 2: Convert the containment area from square feet to the consistent units required by the formula. Most engineers work in square feet and convert to gallons using the standard conversion factor.
Step 3: Apply the precipitation volume formula: Volume in gallons = (rainfall inches × area square feet × 0.623). The conversion factor 0.623 accounts for the unit transformation from inches and square feet to gallons.
Step 4: Calculate the displaced volume from any tanks or equipment within the containment area. Subtract this displaced volume from the total containment capacity to determine available storage for precipitation.
Step 5: Verify unit consistency throughout the calculation. Mixing feet and inches or forgetting area conversions creates errors that EPA inspectors catch during plan reviews.
Drainage systems complicate the calculation when containment areas include permanent or temporary drainage outlets. If your system has drainage valves that remain closed during normal operations, calculate as if the drainage doesn’t exist. Only credit drainage capacity if valves operate automatically and can handle the design storm flow rate.
Containment systems with irregular shapes require area calculations using surveying techniques or CAD software. Break complex shapes into simple geometric components, calculate each area separately, then sum the results for total containment footprint.
What Freeboard Height Should You Design For?

Freeboard height must exceed precipitation depth plus 6-inch regulatory minimum according to EPA regulations. This means your actual freeboard requirement equals the 25-year, 24-hour precipitation depth at your location plus six inches, calculated based on your specific containment geometry.
Regulatory minimums establish the absolute floor for compliance, while engineering best practices typically exceed these requirements. Most facilities design for 12-18 inches of freeboard to account for wave action and splash during filling operations, tank maintenance activities, and extreme weather events beyond the design storm.
Bulk storage facilities face unique challenges because large tank volumes displace significant precipitation within containment areas. A 100,000-gallon tank in a tight containment area displaces far more storm water than the same tank in an oversized containment system. The relationship between tank volume and containment area directly affects required freeboard height.
Engineering factors that influence freeboard design include wind-driven wave action against containment walls, splash from tank venting during pressure changes, thermal expansion of stored liquids during temperature swings, and settlement of containment structures over time. Conservative design approaches account for these variables with additional freeboard margin.
EPA regulations don’t specify maximum freeboard limits, so overdesigning provides operational flexibility and compliance insurance. However, excessive freeboard increases construction costs and may create access challenges for maintenance activities.
Containment geometry affects freeboard calculations differently than tank geometry. Wide, shallow containment areas require more freeboard per inch of precipitation than narrow, deep systems. The surface area exposed to precipitation drives the volume calculation, while the containment depth determines how much freeboard each gallon of storm water consumes.
Facilities with multiple tanks in shared containment must calculate freeboard based on maximum tank capacity and worst-case precipitation scenarios simultaneously. The largest credible spill combined with the design storm represents the critical case for freeboard adequacy.
Common SPCC Freeboard Calculation Mistakes

Calculation errors result in EPA violations and retrofit costs averaging $47,000 per facility when inspectors discover inadequate freeboard during compliance reviews. These mistakes typically stem from misunderstanding regulatory requirements rather than mathematical errors in the calculations themselves.
The most frequent error involves using regional precipitation data instead of site-specific NOAA Atlas 14 values. Engineers often substitute nearby weather station data or use precipitation values from similar facilities in the same area. EPA Region 5 cited freeboard deficiencies in 23% of SPCC inspections between 2019-2021, with incorrect precipitation data accounting for nearly half of these violations.
Another common mistake treats tank footprint area as containment area for precipitation calculations. The correct approach uses the total interior containment area exposed to precipitation, which often exceeds tank footprint by significant margins. This error typically underestimates required freeboard by 20-40% depending on containment design.
SPCC plan documentation frequently omits the calculation methodology or references outdated precipitation data sources. EPA inspectors specifically look for NOAA Atlas 14 citations, calculation worksheets, and design drawings that demonstrate proper freeboard verification. Missing documentation triggers violation notices even when physical freeboard meets requirements.
Oil storage facilities sometimes ignore equipment displacement within containment areas when calculating available volume for precipitation. Pumps, piping, electrical equipment, and structural supports all reduce the effective containment capacity. Forgetting to account for displacement can result in freeboard deficiencies during actual storm events.
Secondary containment systems with complex drainage arrangements create calculation confusion when engineers can’t determine whether to credit drainage capacity in freeboard calculations. The conservative approach assumes drainage systems fail or remain closed during storm events unless automatic operation can be demonstrated and maintained.
Spill prevention requirements change over time as EPA updates guidance documents and regional offices clarify interpretation of existing regulations. Facilities using decades-old calculation methods may discover their approaches no longer meet current compliance standards during routine inspections or plan updates.